The Dream Machine: How Lotteries Capture Our Imagination
Lotteries are among the most widespread forms of gambling on the planet. In the United States alone, Americans spend over $100 billion on lottery tickets each year. The EuroMillions draw attracts players across thirteen European nations. Everywhere you look, people are buying tickets and hoping for a life-changing windfall.
But what are the actual odds? And when we dig into the mathematics, what do the numbers really tell us about the "luck" of winning? The answers are humbling, fascinating, and ultimately illuminating about how humans think about chance.
The Combinatorics: Just How Unlikely Is a Jackpot?
To understand lottery odds, you need one formula from combinatorics: the combination formula, often written as C(n, k) = n! / (k! * (n - k)!). This tells us how many ways we can choose k items from a set of n items when order does not matter.
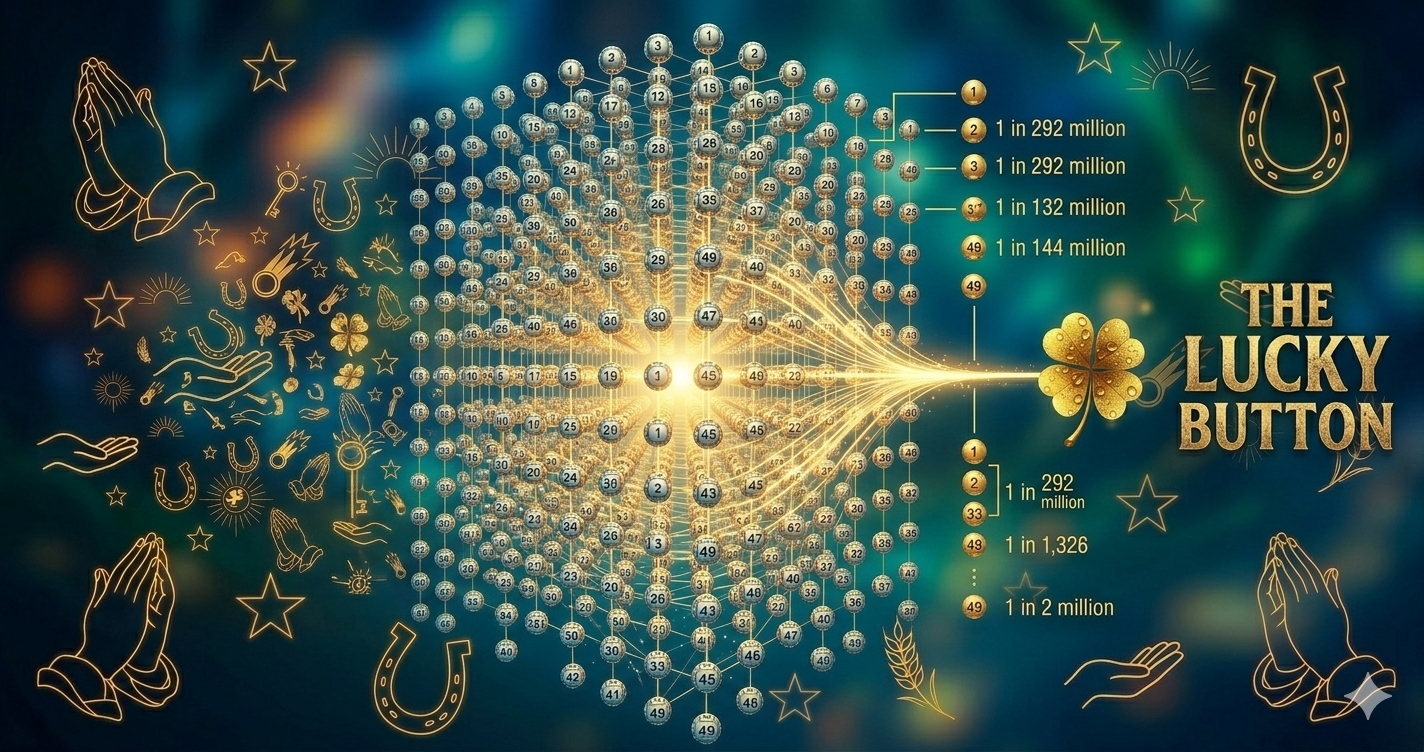
Powerball (US): Players choose 5 numbers from 1 to 69, then one Powerball number from 1 to 26. The number of possible combinations for the first five numbers is C(69, 5) = 11,238,513. Multiply that by the 26 possible Powerball numbers, and you get 292,201,338 possible tickets. Your chance of winning the jackpot with a single ticket is approximately 1 in 292.2 million.
EuroMillions: Players pick 5 numbers from 1 to 50 and 2 "Lucky Stars" from 1 to 12. The total combinations are C(50, 5) x C(12, 2) = 2,118,760 x 66 = 139,838,160. That is roughly 1 in 139.8 million.
Mega Millions (US): Choose 5 numbers from 1 to 70, plus a Mega Ball from 1 to 25. Total combinations: C(70, 5) x 25 = 12,103,014 x 25 = 302,575,350. That is about 1 in 302.6 million.
To put these numbers in perspective: you are roughly 300 times more likely to be struck by lightning in your lifetime (about 1 in 1 million according to the National Weather Service) than to win the Powerball jackpot on any single ticket. You are more likely to be dealt a royal flush in poker on the first hand (about 1 in 649,740) than to win any of these major jackpots.
Expected Value: What Is Your Ticket Really Worth?
Expected value (EV) is a mathematical concept that tells you the average outcome of a random event if you could repeat it an infinite number of times. For a lottery ticket, the calculation is straightforward: multiply each possible prize by its probability, then subtract the ticket cost.
For a $2 Powerball ticket, the expected value of all non-jackpot prizes combined is approximately $0.32. The jackpot contribution depends on its current size. For the expected value to reach $2 (the break-even point), the jackpot would need to be approximately $550 million or more — and that is before taxes and before accounting for the possibility of splitting the prize with other winners.
In practice, the expected value of a lottery ticket is almost always negative. A $2 ticket is typically worth between $0.50 and $0.90 in expected returns. This is how lotteries fund themselves. Across the industry, lotteries typically return about 50-60 cents on every dollar wagered, keeping the rest for prizes, operations, and government revenue.
Does this mean playing the lottery is irrational? Not necessarily. Economists distinguish between expected value and expected utility. A $2 lottery ticket might provide several dollars worth of entertainment, hope, and daydreaming value. The problem arises when people spend money they cannot afford or when they genuinely believe they have a meaningful chance of winning.
Why "Lucky Numbers" Do Not Exist
One of the most persistent myths in lottery play is the idea that certain numbers are "luckier" than others. People choose birthdays, anniversaries, jersey numbers, and numbers from fortune cookies. Some players track "hot" and "cold" numbers — those that have appeared frequently or infrequently in recent draws.
The mathematical reality is unambiguous: in a fair lottery, every combination has exactly the same probability of being drawn. The combination 1-2-3-4-5 with Powerball 6 is precisely as likely as any other combination. The draws are independent events, meaning past results have zero influence on future outcomes.
This is sometimes called the gambler's fallacy — the belief that if something happens more frequently than normal during a given period, it will happen less frequently in the future (or vice versa). A roulette wheel that has landed on red ten times in a row is not "due" for black. Each spin is independent. The same principle applies to lottery draws.
Research by Clotfelter and Cook (1993) at Duke University found that lottery players systematically avoid numbers that won recently, even though these numbers are exactly as likely to appear again as any others. This behavior actually has a practical consequence: if a recently drawn number does come up again, fewer people will have it, meaning less prize splitting.
The Hot Hand Fallacy in Number Picking
Related to the gambler's fallacy is the "hot hand" fallacy — the belief that a number on a "winning streak" is more likely to continue appearing. A 2015 study published in Cognitive Psychology by Miller and Sanjurjo showed that even sophisticated analysts can mistake random sequences for meaningful patterns.
In lottery contexts, companies sell "hot number" analysis services and software claiming to identify trends in random draws. These products exploit a cognitive weakness: the human brain is a pattern-detection machine, and it finds patterns even in pure noise. When you look at a sequence of random lottery draws, certain numbers will inevitably appear more often than others over any finite period — this is simply statistical variation, not a signal.
Studies by Holtgraves and Skeel (1992) demonstrated that people who believe in lucky numbers also tend to score higher on measures of illusory pattern perception. The same cognitive tendency that makes us see faces in clouds makes us see meaning in random number sequences.
Historical Jackpots vs. Statistical Expectations
The largest lottery jackpots in history make for spectacular headlines. The record Powerball jackpot of $2.04 billion was won in November 2022 by a single ticket in California. A $1.537 billion Mega Millions prize was claimed in 2018. These life-altering sums drive ticket sales to extraordinary levels.
But consider the statistical context. Powerball has been drawn twice a week since 1992. Over tens of thousands of drawings, jackpot winners are expected to emerge periodically. What feels miraculous to the individual winner is essentially inevitable from a statistical perspective — given enough draws and enough tickets sold, someone will eventually match all the numbers.
The same principle explains why lottery winners sometimes come from the same town or even the same family. With hundreds of millions of tickets sold per draw across millions of households, these coincidences are not just possible — they are statistically expected. What would be truly remarkable is if such coincidences never occurred.
The Social and Psychological Dimension
Research by economists Friedman and Savage (1948) proposed that lotteries appeal to people who are risk-averse in most domains of life but risk-seeking when it comes to small-probability, large-payoff gambles. A $2 ticket represents an affordable purchase of possibility — the chance, however remote, that everything changes.
Psychologist Daniel Kahneman's prospect theory, developed with Amos Tversky and detailed in their seminal work, explains another dimension: humans systematically overweight small probabilities. We treat a 1-in-300-million chance as if it were much more likely than it is. This "possibility effect" means that going from 0% to 0.00000034% feels like a much bigger jump than the numbers suggest.
There is also the "availability heuristic" at work. Lottery winners receive enormous media coverage, making winning feel more common than it is. We can easily picture a winner holding an oversized check because we have seen the image thousands of times. We cannot easily picture the hundreds of millions of people who did not win that same week.
A Responsible Perspective
None of this means you should never buy a lottery ticket. For most people, an occasional $2 ticket is a harmless entertainment expense — no different from buying a cup of coffee or renting a movie. The key is understanding what you are buying: a few days of pleasant anticipation, not a realistic financial strategy.
The mathematics of lotteries teaches us valuable lessons about luck. True probability literacy helps us make better decisions not just about lottery tickets but about risk assessment in general — from insurance to investments to medical decisions. Understanding expected value, independence of events, and the gambler's fallacy makes us better thinkers in every domain.
Luck in the lottery is vanishingly rare. But the mathematical thinking we gain from studying it? That is genuinely valuable — and available to everyone.
📚 References & Further Reading
- Selling Hope: State Lotteries in America — Clotfelter, C. T., & Cook, P. J. (1993)
- Surprised by the Hot Hand Fallacy? A Truth in the Law of Small Numbers — Miller, J. B., & Sanjurjo, A. (2018)
- Thinking, Fast and Slow — Kahneman, D. (2011)
- The Utility Analysis of Choices Involving Risk — Friedman, M., & Savage, L. J. (1948)
- Perception of randomness: On the use and misuse of sequences in gambling — Holtgraves, T., & Skeel, J. (1992)
Lucky Button Team
Educators & Probability Researchers
A multidisciplinary team of psychology graduates, data scientists, and educators dedicated to making the science of luck accessible and fun.
Learn more about our team →Join the Conversation
Tell Us: What does luck mean to you?
Loading comments...